Assignment 07
과제 정의
[Apply K-means algorithm to both image value and its spatial domain]
For a given input image (either gray or color), apply a K-means algorithm that is designed to take into consideration of both the image intensity and its spatial domain with varying parameters: the number of clusters and the trade-off between the intensity energy and the spatial energy.
The objective function is given by:
where I(k) denotes the index set of x that belongs to cluster k, m_k denotes the centroid of image intensity for cluster k, c_k denotes the centroid of spatial location for cluster k, and a determines the importance between the image intensity and the spatial relation.
- Visualize the clustering results with varying k and a using the centroid color m_k for each cluster k.

- Visualize the energy curve for both the intensity energy and the spatial energy.
모듈 정의
그래프를 그리기 위해 Python3 matplotlib module 을 사용합니다
import matplotlib.pyplot as plt
import numpy as np
import random
from PIL import Image
1. 기본 데이터 입력받기
아래의 이미지로 진행합니다.
import IPython.display
IPython.display.Image(filename='test.jpg')

2. 필요 함수 선언
init 함수
- label이 들어갈 matrix(이미지 크기)에 label값을 넣습니다.
- x1,x2(위치좌표), rgb, label이 들어갈 matrix를 만듭니다.
- 총 3개의 matrix를 구성하여 반환합니다.
def init(rows,cols,K,pix):
    label_matrix = [[0 for x in range(0,cols)] for y in range(0,rows)]
    x1 = np.zeros((rows * cols), dtype=int)
    x2 = np.zeros((rows * cols), dtype=int)
    for row in range(0,rows):
        for col in range(0,cols):
            rgb = tuple(ti/255 for ti in pix[row,col])
            label_matrix[row][col] = (random.randrange(1,K+1),rgb,[row/(rows-1),col/(cols-1)])
            #label_matrix[row][col] = (random.randrange(1,K+1),pix[row,col])
            index = (row * cols) + col
            x1[index] = row
            x2[index] = col
    return label_matrix, x1, x2
get_locate_by_label 함수
- 배정받은 클러스터의 label 별로 데이터를 모읍니다.
- 결과적으로 반환 값은 label별로 모여 있는 5차원의 데이터를 받습니다.
def get_locate_rgb_by_label(rows,cols,x1,x2,label_matrix):
    dic = dict()
    for i in range(0, len(x1)):
        row = x1[i]
        col = x2[i]
        data = label_matrix[row][col]
        if data[0] not in dic:
            dic[data[0]] = []
            dic[data[0]].append([data[2],data[1]])
        else:
            dic[data[0]].append([data[2],data[1]])

    return dic
centroid_select 함수
- get_locate_rgb_by_label에서 받은 label별로 모여있는 정보들의 centroid를 만드는 작업을 합니다.
- 각 label 별로 저장되어있는 모든 정보의 합을 각 label 별로 저장되어있는 모든 데이터의 수로 나눕니다. (중심값을 얻습니다.)
- 결과적으로 centroid_rgb, centroid_locate에 각 클러스터 별 위치, rgb의 centroid의 값을 저장하게 됩니다.
def centroid_select(dic):
    centroid_rgb = dict()
    centroid_locate = dict()
    for i in dic:
        rgb = []
        locate = []
        for x in dic[i]:
            rgb.append(x[1])
            locate.append(x[0])
        rgb = list(map(list, rgb))
        centroid_rgb[i] = np.sum(np.array(rgb), axis = 0) / len(rgb)
        centroid_locate[i] = np.sum(np.array(locate), axis = 0)/len(locate)
    return centroid_rgb, centroid_locate
cluster 함수
- 각 클러스터의 centroid_rgb, centroid_locate와의 거리를 구하여 가장 거리가 짧은 거리의 label을 따라갑니다.
- $$dist = ((r - C_r)^2 + (g - C_g)^2 + (b - C_b)^2) + Lambda*((x - C_x)^2 + (y - C_y)^2)$ $
- 위의 식으로 거리를 구하고 각 클러스터의 거리 중 짧은 거리의 클러스터 label을 따라갑니다.
def cluster(label_matrix,x1,x2,rgb,locate,Lambda):
    for i in range(0, len(x1)):
        row = x1[i]
        col = x2[i]
        minDist = 99999999
        label = 99999999
        for i in range(1,len(rgb) + 1):
            data = label_matrix[row][col]
            locate_dist = Lambda * (pow((locate[i][0] - data[2][0]),2) + pow((locate[i][1] - data[2][1]),2))
            rgb_dist = pow((rgb[i][0] - data[1][0]),2) + pow((rgb[i][1] - data[1][1]),2) + pow((rgb[i][2] - data[1][2]),2)
            dist = locate_dist + rgb_dist
            if minDist > dist:
                minDist = dist
                label = (i,data[1],data[2])
        label_matrix[row][col] = label


    return label_matrix
get_energyfunction_val 함수와 show_energyfunction 함수
- energy function의 값을 구하는 함수입니다.
I (K)는 K 개의 클러스터에 속한 X의 세트의 인덱스를 나타내고, $m_k$ 클러스터 k에 대한 이미지 데이터의 중심을 나타내고, $C_K$ 클러스터 k에 대한 공간 위치의 중심 및 여부를 확인 나타낸다 이미지 강도와 공간적 관계 사이의 중요성.
위 연산을 구현한 것으로 energy를 구합니다.
- show_energyfunction는 get_energyfunction_val에서 받은 energy의 값을 가지고 plot을 해주는 함수입니다.
def get_energyfunction_val(dic,rgb,locate,Lambda,K):
    val = 0
    for i in dic:
        i_locate_dist = 0
        i_rgb_dist = 0
        for x in dic[i]:
            _rgb = x[1]
            _locate = x[0]
            locate_dist = Lambda * (pow((locate[i][0] - _locate[0]),2) + pow((locate[i][1] - _locate[1]),2))
            rgb_dist = pow((rgb[i][0] - _rgb[0]),2) + pow((rgb[i][1] - _rgb[1]),2) + pow((rgb[i][2] - _rgb[2]),2)
            i_locate_dist = i_locate_dist + locate_dist
            i_rgb_dist = i_rgb_dist + rgb_dist
        dist = i_locate_dist + i_rgb_dist
        val = val + dist
    return val / K

def show_energyfunction(iter,energy):
    plt.xlabel("iterator")
    plt.ylabel("energy")
    plt.plot(range(0,iter), energy)
    plt.show()
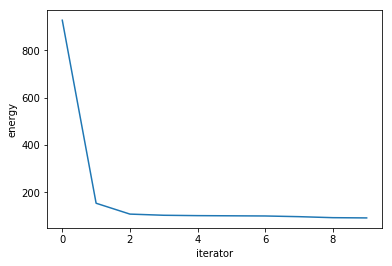
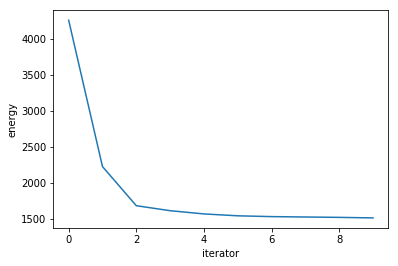
3. 테스트(Energy 함수와 결과 이미지 비교) - K가 5일때
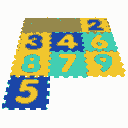
K=5 // iterator = 10 // Lambda = 0
im = Image.open('test.jpg') # Can be many different formats.
pix = im.load()
K = 5
Lambda = 0
energy = []
iterator = 10

while True:
    label_matrix , x1, x2 = init(im.size[1],im.size[0],K,pix)
    dic = get_locate_rgb_by_label(im.size[1],im.size[0],x1,x2,label_matrix)
    centroid_rgb, centroid_locate = centroid_select(dic)
    if len(list(set([tuple(set(item)) for item in [*centroid_locate.values()] ]))) == K:
        break

for x in range(0,iterator):
    label_matrix = cluster(label_matrix,x1,x2,centroid_rgb,centroid_locate,Lambda)
    energy.append(get_energyfunction_val(dic,centroid_rgb,centroid_locate,Lambda,K))
    dic = get_locate_rgb_by_label(im.size[1],im.size[0],x1,x2,label_matrix)
    centroid_rgb, centroid_locate = centroid_select(dic)


show_energyfunction(iterator,energy)

for x in range(0,im.size[1]):
    for y in range(0,im.size[0]):
        pixel = centroid_rgb[label_matrix[x][y][0]]
        pixel = tuple(ti * 255 for ti in pixel)
        pix[x,y] = (int(pixel[0]),int(pixel[1]),int(pixel[2]))
    im.save(str(K) + "_result.png")

import IPython.display
IPython.display.Image(filename=str(K) + "_result.png")
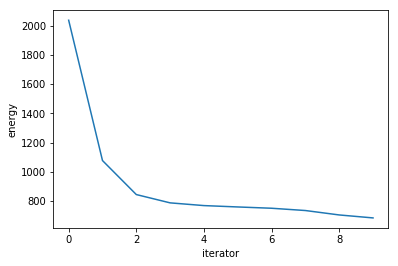
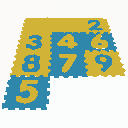
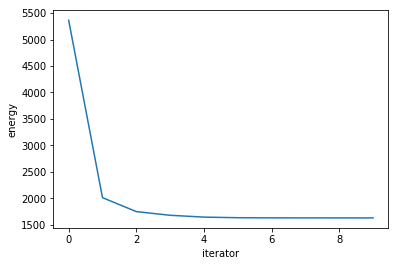
K=5 // iterator = 10 // Lambda = 2
im = Image.open('test.jpg') # Can be many different formats.
pix = im.load()
K = 5
Lambda = 2
energy = []
iterator = 10

while True:
    label_matrix , x1, x2 = init(im.size[1],im.size[0],K,pix)
    dic = get_locate_rgb_by_label(im.size[1],im.size[0],x1,x2,label_matrix)
    centroid_rgb, centroid_locate = centroid_select(dic)
    if len(list(set([tuple(set(item)) for item in [*centroid_locate.values()] ]))) == K:
        break

for x in range(0,iterator):
    label_matrix = cluster(label_matrix,x1,x2,centroid_rgb,centroid_locate,Lambda)
    energy.append(get_energyfunction_val(dic,centroid_rgb,centroid_locate,Lambda,K))
    dic = get_locate_rgb_by_label(im.size[1],im.size[0],x1,x2,label_matrix)
    centroid_rgb, centroid_locate = centroid_select(dic)


show_energyfunction(iterator,energy)

for x in range(0,im.size[1]):
    for y in range(0,im.size[0]):
        pixel = centroid_rgb[label_matrix[x][y][0]]
        pixel = tuple(ti * 255 for ti in pixel)
        pix[x,y] = (int(pixel[0]),int(pixel[1]),int(pixel[2]))
    im.save(str(K) + "_result.png")

import IPython.display
IPython.display.Image(filename=str(K) + "_result.png")
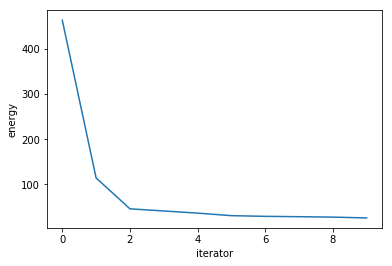
K=5 // iterator = 10 // Lambda = 4
im = Image.open('test.jpg') # Can be many different formats.
pix = im.load()
K = 5
Lambda = 4
energy = []
iterator = 10

while True:
    label_matrix , x1, x2 = init(im.size[1],im.size[0],K,pix)
    dic = get_locate_rgb_by_label(im.size[1],im.size[0],x1,x2,label_matrix)
    centroid_rgb, centroid_locate = centroid_select(dic)
    if len(list(set([tuple(set(item)) for item in [*centroid_locate.values()] ]))) == K:
        break

for x in range(0,iterator):
    label_matrix = cluster(label_matrix,x1,x2,centroid_rgb,centroid_locate,Lambda)
    energy.append(get_energyfunction_val(dic,centroid_rgb,centroid_locate,Lambda,K))
    dic = get_locate_rgb_by_label(im.size[1],im.size[0],x1,x2,label_matrix)
    centroid_rgb, centroid_locate = centroid_select(dic)


show_energyfunction(iterator,energy)

for x in range(0,im.size[1]):
    for y in range(0,im.size[0]):
        pixel = centroid_rgb[label_matrix[x][y][0]]
        pixel = tuple(ti * 255 for ti in pixel)
        pix[x,y] = (int(pixel[0]),int(pixel[1]),int(pixel[2]))
    im.save(str(K) + "_result.png")

import IPython.display
IPython.display.Image(filename=str(K) + "_result.png")

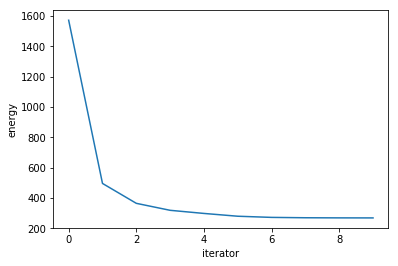
K=5 // iterator = 10 // Lambda = 8
im = Image.open('test.jpg') # Can be many different formats.
pix = im.load()
K = 5
Lambda = 8
energy = []
iterator = 10

while True:
    label_matrix , x1, x2 = init(im.size[1],im.size[0],K,pix)
    dic = get_locate_rgb_by_label(im.size[1],im.size[0],x1,x2,label_matrix)
    centroid_rgb, centroid_locate = centroid_select(dic)
    if len(list(set([tuple(set(item)) for item in [*centroid_locate.values()] ]))) == K:
        break

for x in range(0,iterator):
    label_matrix = cluster(label_matrix,x1,x2,centroid_rgb,centroid_locate,Lambda)
    energy.append(get_energyfunction_val(dic,centroid_rgb,centroid_locate,Lambda,K))
    dic = get_locate_rgb_by_label(im.size[1],im.size[0],x1,x2,label_matrix)
    centroid_rgb, centroid_locate = centroid_select(dic)


show_energyfunction(iterator,energy)

for x in range(0,im.size[1]):
    for y in range(0,im.size[0]):
        pixel = centroid_rgb[label_matrix[x][y][0]]
        pixel = tuple(ti * 255 for ti in pixel)
        pix[x,y] = (int(pixel[0]),int(pixel[1]),int(pixel[2]))
    im.save(str(K) + "_result.png")

import IPython.display
IPython.display.Image(filename=str(K) + "_result.png")

3. 테스트(Energy 함수와 결과 이미지 비교) - K가 10일때
K=10 // iterator = 10 // Lambda = 0
im = Image.open('test.jpg') # Can be many different formats.
pix = im.load()
K = 10
Lambda = 0
energy = []
iterator = 10

while True:
    label_matrix , x1, x2 = init(im.size[1],im.size[0],K,pix)
    dic = get_locate_rgb_by_label(im.size[1],im.size[0],x1,x2,label_matrix)
    centroid_rgb, centroid_locate = centroid_select(dic)
    if len(list(set([tuple(set(item)) for item in [*centroid_locate.values()] ]))) == K:
        break

for x in range(0,iterator):
    label_matrix = cluster(label_matrix,x1,x2,centroid_rgb,centroid_locate,Lambda)
    energy.append(get_energyfunction_val(dic,centroid_rgb,centroid_locate,Lambda,K))
    dic = get_locate_rgb_by_label(im.size[1],im.size[0],x1,x2,label_matrix)
    centroid_rgb, centroid_locate = centroid_select(dic)


show_energyfunction(iterator,energy)

for x in range(0,im.size[1]):
    for y in range(0,im.size[0]):
        pixel = centroid_rgb[label_matrix[x][y][0]]
        pixel = tuple(ti * 255 for ti in pixel)
        pix[x,y] = (int(pixel[0]),int(pixel[1]),int(pixel[2]))
    im.save(str(K) + "_result.png")

import IPython.display
IPython.display.Image(filename=str(K) + "_result.png")

K=10 // iterator = 10 // Lambda = 4
im = Image.open('test.jpg') # Can be many different formats.
pix = im.load()
K = 10
Lambda = 4
energy = []
iterator = 10

while True:
    label_matrix , x1, x2 = init(im.size[1],im.size[0],K,pix)
    dic = get_locate_rgb_by_label(im.size[1],im.size[0],x1,x2,label_matrix)
    centroid_rgb, centroid_locate = centroid_select(dic)
    if len(list(set([tuple(set(item)) for item in [*centroid_locate.values()] ]))) == K:
        break

for x in range(0,iterator):
    label_matrix = cluster(label_matrix,x1,x2,centroid_rgb,centroid_locate,Lambda)
    energy.append(get_energyfunction_val(dic,centroid_rgb,centroid_locate,Lambda,K))
    dic = get_locate_rgb_by_label(im.size[1],im.size[0],x1,x2,label_matrix)
    centroid_rgb, centroid_locate = centroid_select(dic)


show_energyfunction(iterator,energy)

for x in range(0,im.size[1]):
    for y in range(0,im.size[0]):
        pixel = centroid_rgb[label_matrix[x][y][0]]
        pixel = tuple(ti * 255 for ti in pixel)
        pix[x,y] = (int(pixel[0]),int(pixel[1]),int(pixel[2]))
    im.save(str(K) + "_result.png")

import IPython.display
IPython.display.Image(filename=str(K) + "_result.png")

K=10 // iterator = 10 // Lambda = 9
im = Image.open('test.jpg') # Can be many different formats.
pix = im.load()
K = 10
Lambda = 9
energy = []
iterator = 10

while True:
    label_matrix , x1, x2 = init(im.size[1],im.size[0],K,pix)
    dic = get_locate_rgb_by_label(im.size[1],im.size[0],x1,x2,label_matrix)
    centroid_rgb, centroid_locate = centroid_select(dic)
    if len(list(set([tuple(set(item)) for item in [*centroid_locate.values()] ]))) == K:
        break

for x in range(0,iterator):
    label_matrix = cluster(label_matrix,x1,x2,centroid_rgb,centroid_locate,Lambda)
    energy.append(get_energyfunction_val(dic,centroid_rgb,centroid_locate,Lambda,K))
    dic = get_locate_rgb_by_label(im.size[1],im.size[0],x1,x2,label_matrix)
    centroid_rgb, centroid_locate = centroid_select(dic)


show_energyfunction(iterator,energy)

for x in range(0,im.size[1]):
    for y in range(0,im.size[0]):
        pixel = centroid_rgb[label_matrix[x][y][0]]
        pixel = tuple(ti * 255 for ti in pixel)
        pix[x,y] = (int(pixel[0]),int(pixel[1]),int(pixel[2]))
    im.save(str(K) + "_result.png")

import IPython.display
IPython.display.Image(filename=str(K) + "_result.png")